Integrations
Works with the stack you already run
Cordant connects via read-only API credentials and webhook subscriptions. No agents, no sidecars, no instrumentation changes. Your existing observability investment is the input.
The ecosystem at a glance
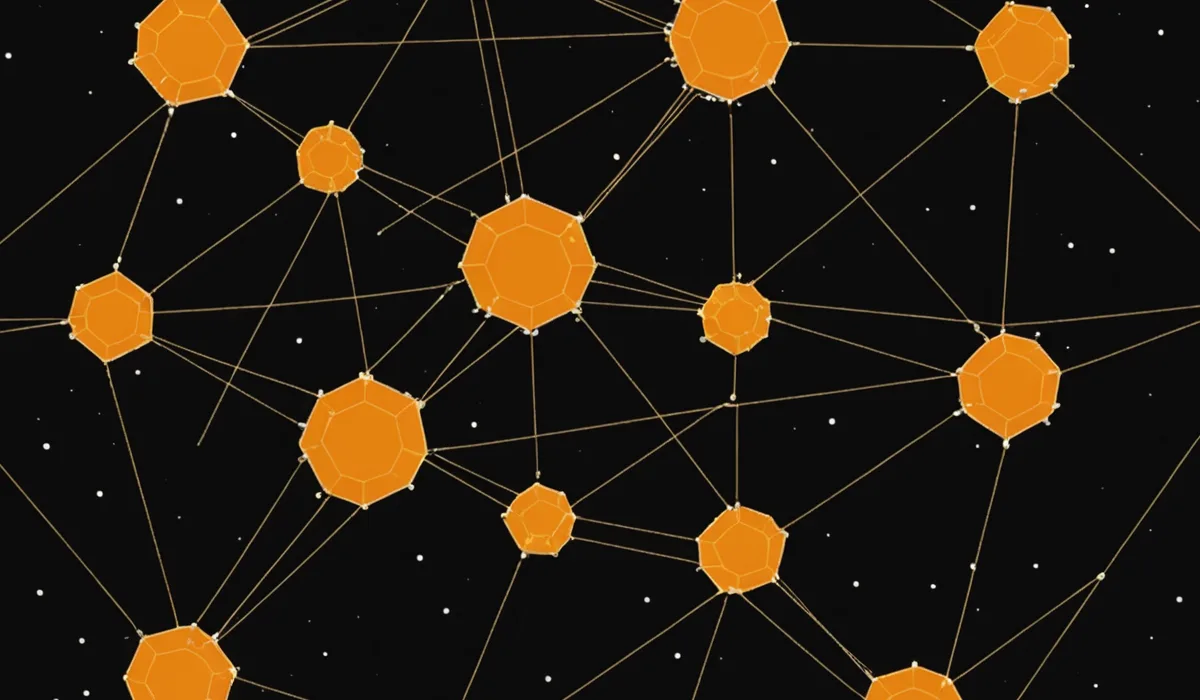
Cordant ingests from metrics, logs, traces, and deployment pipelines simultaneously. The signal graph correlates across sources so a database slowdown, a CDN latency spike, and a fresh deploy appear as one incident, not three separate alerts.
Supported integrations
Metrics and observability
Datadog
Metrics, APM, logs
Prometheus
Metrics, alerting
CloudWatch
Metrics, logs, events
Grafana
Dashboards, alerts
New Relic
APM, infrastructure
OpenTelemetry
Traces, metrics, logs
Incident management and alerting
PagerDuty
Alerts, escalations, runbooks
OpsGenie
On-call scheduling, alerts
Slack
Incident briefs, approvals
Deployment and CI/CD
GitHub Actions
Deploy events, rollbacks
GitLab CI
Pipeline events, rollbacks
ArgoCD
GitOps deploy events
Kubernetes
Pod events, rollout status
On the roadmap
These integrations are in development. If your stack is listed here, contact us to join the early access group.
Elastic APM
Coming soon
Azure Monitor
Coming soon
Honeycomb
Coming soon
Sentry
Coming soon
Connect your stack in a day
Read-only API credentials and a 15-minute guided setup session is all it takes.